Visualization of Researcher Catalog
This visualization illustrates how the research themes of researchers belonging to the Graduate School of Agricultural and Life Sciences and the Faculty of Agriculture are connected through their research contents and keywords.
Researcher × Keyword
This visualization represents the relationships between researchers and their research keywords. The connections (edges) indicate which keywords are associated with each researcher. Three different methods were used to extract keywords, and you can switch between them using the tabs below.
Network
Here, keywords are extracted directly from the keyword field of the researcher catalog. Each connection (edge) represents an association between a researcher and a keyword. For details of the analysis method, see below.
Analysis Method
This is a simple network based on the keyword field.
First, keywords are extracted from the keyword section at the bottom of each researcher’s catalog page.
Next, a network graph is created based on these keywords.
In the graph, for example, if Researcher A’s keyword field contains Keyword B, the node representing A is connected to the node representing B by an edge.
Finally, to reduce redundancy, keywords that appear for only one researcher (i.e., connected to only one node) are removed.
This graph reflects the researchers’ own awareness of how they define their research through their selected keywords.
Researcher × Researcher
Network
Here, the research descriptions in the catalog are analyzed using Doc2Vec, and the resulting similarities between researchers are visualized as a network. The connections (edges) indicate that two researchers have highly related research content. For details of the analysis method, see below.
Analysis Method
The similarity between researchers is visualized based on the content of their research descriptions.
This similarity is calculated using Doc2Vec (Document to Vector), a method that converts entire documents into numerical vectors for comparison.
Doc2Vec considers not only the frequency of words but also their order and context within sentences.
By learning the distribution and contextual patterns of words, it constructs a vector space where similar texts are positioned close together.
Specifically, each researcher’s research description is represented as a document vector.
Cosine similarity between these vectors quantifies how closely related their research topics are.
The resulting network captures researcher relationships based not only on shared keywords but also on contextual and semantic similarity.
This approach reveals latent research affinities and potential interdisciplinary collaborations that might not be visible through keyword-based analysis alone.
Keyword × Keyword
Network
Here, the research descriptions in the catalog are analyzed using FastText, and relationships between research keywords are visualized. The connections (edges) indicate strong semantic associations between keywords. For details of the analysis method, see below.
Analysis Method
Relationships between research keywords are visualized using the fastText algorithm.
fastText learns how words are used in context by analyzing their surrounding words and converts each word into a numerical vector.
It also decomposes words into smaller character units (subwords), allowing it to capture relationships among words with different spellings or inflections and to handle previously unseen words effectively.
Specifically, fastText is trained on the keywords appearing in researchers’ descriptions, and cosine similarity between the resulting keyword vectors is calculated.
This allows semantically similar words—such as “microbiome” and “microbial community” or “machine learning” and “deep learning”—to appear close together in the graph.
As a result, the graph reflects semantic and conceptual relationships between keywords rather than simple frequency-based associations.
This visualization highlights abstract thematic connections and identifies key linking concepts that bridge research domains,
offering insights into interdisciplinary relationships and new avenues for collaboration.
How to Read and Use the Graphs
Understanding Graph
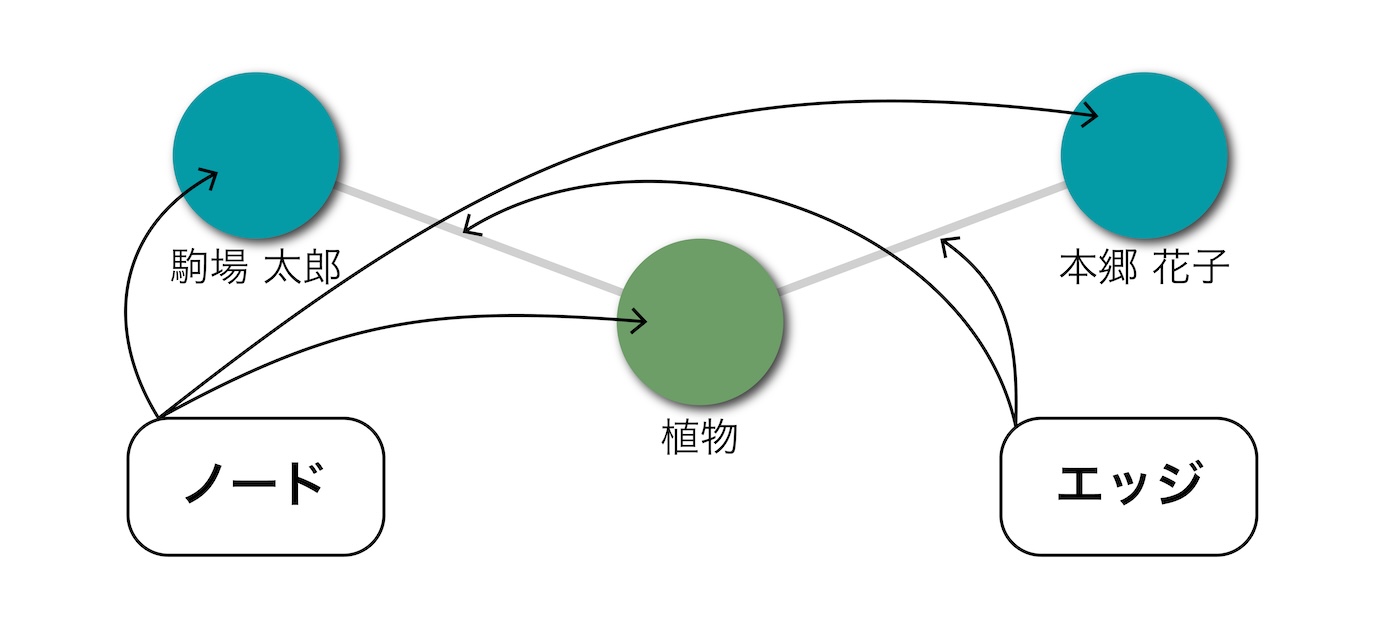
- Nodes and Edges
The dots on the screen are called “nodes,” and the lines connecting them are “edges.” - Meaning of Nodes
Each node represents one researcher or one keyword. The label below each node shows its name. - Meaning of Edges
Edges represent “connections” or “relationships” between nodes. For example, in the Researcher–Keyword graph, they represent that a researcher’s work is associated with a keyword; in the Researcher–Researcher graph, they represent similarity between research contents; and in the Keyword–Keyword graph, they represent semantic similarity between research terms.
Navigation (Zoom and Pan)
- Using On-screen Buttons (not available on mobile)
1. Click the “” or “” buttons to zoom in and out.
2. Click the arrow buttons “”, “”, “”, “” to move the view.
3. Click the “” button to return to the original view and scale.
- Using Mouse or Trackpad
1. Scroll while hovering over the graph to zoom in and out.
2. Drag while hovering over the graph to move freely in any direction. - Using Keyboard
1. Press “^” and “-” keys to zoom in and out.
2. Use the arrow keys “”, “”, “”, “” to move around.
Click Interaction
- Clicking a Node
Clicking a node highlights it along with its connected edges and nodes. Clicking anywhere else resets the highlight. - Node Information
When you click a node, a tooltip appears above it showing details about that node. Clicking on a researcher node shows their name and a link to their researcher catalog page. Selecting “View in Researcher Catalog” opens that page in a new tab.
Search Function
- Search by Researcher Name or Keyword
Enter a researcher’s name or a keyword in the “Search by Keyword or Researcher Name” field above the graph and press Enter (or “Go” on mobile). Matching nodes will be highlighted. Clearing the input resets the highlight. - When Multiple Results Are Found
If multiple researchers share the same name or if multiple keywords contain the entered text, a list of candidates will appear below the search box. Click (or tap) the one you wish to view to highlight it in the graph.